
Effective April 1, 2026, China fully canceled the 9% VAT export tax rebate covering all core photovoltaic products including polysilicon, silicon wafers, solar cells, PV modules, and inverters. Market participants widely anticipated a sharp slump in overseas shipments amid rising export costs, squeezed gross margins, and weakened price competitiveness of Chinese PV goods. However, official customs data for the first half of 2026 delivered a counterintuitive result: total export value of China’s silicon wafer, solar cell and PV module products reached USD 17.183 billion, representing a 24.3% year-on-year surge.
This report dissects segmented export performance across the full PV supply chain, quantifies the short-term “panic shipment” rush before the rebate policy took effect, compares differentiated resilience among upstream, midstream and downstream links, and analyzes the underlying industrial competitiveness that supported sustained export expansion despite the removal of fiscal subsidies. Supported by segmented monthly shipment charts of solar cells, inverters and polysilicon, the article further elaborates short-term market volatility and long-term structural transformation trends for China’s PV export business under the new policy framework.
1. Policy Background & Pre-Policy Market Expectations
On January 8, 2026, China’s Ministry of Finance and State Taxation Administration jointly issued Announcement No.2 of 2026, specifying the complete elimination of VAT export rebates for all PV-related products starting April 1, 2026. Prior to this adjustment, PV exporters enjoyed a 9% VAT rebate rate, a core fiscal buffer that manufacturers factored into international pricing negotiations for over a decade.
Industry institutions and overseas buyers formed three mainstream pessimistic forecasts before the policy implementation:
- Direct cost uplift: The withdrawal of 9% rebates would lift unit export costs by approximately RMB 0.06–0.07 per watt, forcing manufacturers to either raise overseas selling prices and lose order share or absorb margin compression to retain customers人民日报.
- Q2 shipment contraction: A concentrated “pre-tax deadline rush” would inflate March export volumes, followed by sequential month-on-month declines from April to June as overseas clients paused procurement to digest inventory.
- Supply chain reshuffling: Small and medium-sized manufacturers with thin profit margins would be eliminated from export markets, while top-tier integrated giants would face intensified competition from Southeast Asian third-country production bases.
Contrary to these broad bearish expectations, half-year customs statistics validated robust global renewable energy demand and the irreplaceable comprehensive advantages of China’s integrated PV industrial chain. Even without rebate subsidies, Chinese PV goods maintained strong traction across European, Southeast Asian, African and Middle Eastern emerging markets.
2. H1 2026 Aggregate PV Export Overview
From January to June 2026, China’s core midstream PV products (silicon wafers, solar cells, PV modules) recorded aggregate export turnover of USD 17.183 billion, rising 24.3% year-over-year. The shipment rhythm exhibited an obvious three-stage pattern driven by the April 1 rebate cutoff:
- January–February: Steady baseline shipments Volumes were constrained by Lunar New Year factory shutdowns, with moderate order backlogs but no abnormal rush of shipments. Monthly export values stayed within normal seasonal ranges.
- March: Historic pre-policy shipment peak Global importers accelerated order placement and customs clearance to lock in the final rebate benefit, pushing all supply chain segments to hit single-month export volume and revenue highs for H1 2026.
- April–June: Sequential adjustment after policy implementation Month-on-month shipment declines emerged across most segments, yet year-on-year export values remained positive thanks to sustained global energy transition demand and market diversification toward emerging economies.
Segmented performance diverged drastically across the PV value chain: PV modules bore the most immediate policy impact as the largest export category; solar cells demonstrated stable anti-risk capacity; inverters delivered outstanding growth with continuous month-on-month expansion post-April; silicon wafers faced persistent downward price pressure; and polysilicon showed volatile monthly shipment volumes with weak pricing support.
3. Segmented Export Data & Graphic Analysis
3.1 PV Modules: The Largest Export Segment, Sharp Post-March Correction
PV modules constitute the absolute mainstay of China’s PV export portfolio, absorbing the most direct impact from rebate cancellation. Monthly shipment data (unit volume & RMB revenue) for H1 2026 is summarized below:
- January: 37.927 million units, RMB 112.12 billion
- February: 34.151 million units, RMB 112.70 billion (Lunar New Year holiday suppression)
- March: 65.917 million units, RMB 250.93 billion (H1 peak, panic pre-rebate shipments)
- April: 46.113 million units, RMB 168.91 billion (29% month-on-month volume drop post-policy)
- May: 36.964 million units, RMB 123.12 billion (further sequential decline)
March’s explosive volume reflected global buyers rushing to complete customs declarations before April 1 to claim the 9% rebate. After the policy took effect, overseas clients entered inventory destocking cycles, resulting in two consecutive months of falling module shipments. Nevertheless, cumulative H1 module export value still achieved double-digit year-on-year growth, underpinned by robust installation targets in Europe, Latin America and Southeast Asia.
3.2 Solar Cells: Steadier Shipment Resilience vs Modules
Solar cell exports displayed milder volatility compared to finished modules, reflecting diversified downstream demand from overseas component assembly factories and regional tariff circumvention production bases. Monthly export metrics (volume: billion pieces; revenue: RMB billion):
- Jan: 10.04 bln pieces, RMB 31.20 bln
- Feb: 8.30 bln pieces, RMB 30.40 bln
- Mar: 16.47 bln pieces, RMB 63.50 bln (H1 peak)
- Apr: 12.98 bln pieces, RMB 47.15 bln
- May: 8.80 bln pieces, RMB 30.30 bln
- Jun: 7.02 bln pieces, RMB 23.20 bln
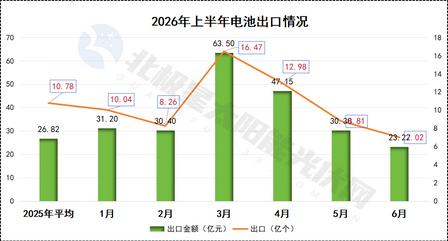
Figure 1: H1 2026 Solar Cell Export Volume & Value
As visualized in Figure 1, solar cell shipments followed the March peak then tapered sequentially through June, yet monthly revenue declines lagged volume drops, signifying stable average selling prices (ASPs) for high-efficiency N-type cell products. Many Southeast Asian module manufacturers rely entirely on imported Chinese solar cells to fulfill local assembly capacity, forming rigid, inelastic intermediate demand that buffered the post-April shipment slump far better than finished modules.
3.3 PV Inverters: The Standout Growth Segment, Continuous Post-April Rally
Inverters emerged as the brightest performer across the entire PV supply chain in H1 2026, delivering consistent month-on-month volume and revenue growth after the VAT rebate removal. Unlike midstream wafer/cell/module products, inverters maintained upward momentum through June without a prolonged post-March correction. Monthly data (volume: ten thousand units; revenue: RMB billion):
- Jan: 382.63 ten thousand units, RMB 59.48 bln
- Feb: 399.71 ten thousand units, RMB 57.29 bln (volume up, ASP slight dip)
- Mar: 325.22 ten thousand units, RMB 52.65 bln (temporary low point before rebound)
- Apr: 407.45 ten thousand units, RMB 64.91 bln (rebound kickoff post-April)
- May: 457.18 ten thousand units, RMB 64.95 bln
- Jun: 500.93 ten thousand units, RMB 84.08 bln (H1 all-time peak)
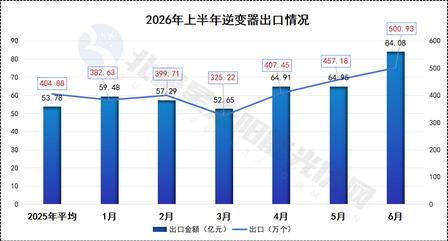
Figure 2: H1 2026 PV Inverter Export Volume & Value
Figure 2 clearly illustrates the divergent trajectory of inverters versus other PV segments: March recorded a minor seasonal trough, followed by four straight months of expansion, with June hitting H1 highs both in shipment quantity and revenue. Two core drivers fueled this counter-trend growth:
- Booming distributed solar & residential storage demand globally: European rooftop PV, African off-grid systems, and Southeast Asian commercial solar installations all require high-performance grid-tied inverters, a product category where Chinese manufacturers hold over 70% global market share.
- High value-added product mix upgrade: Exports shifted toward hybrid solar-storage inverters and high-power central inverters, lifting average unit prices and offsetting any cost pressure from canceled VAT rebates. Inverter product lines face less homogeneous price competition than standardized silicon wafers or PV modules, enabling suppliers to pass partial cost increases to overseas buyers without severe order losses.
3.4 Silicon Wafers: Persistent Downward Price Pressure, Fragile Profitability
The silicon wafer segment faced sustained oversupply and ASP erosion throughout H1 2026, despite March’s pre-policy shipment surge. Statistical scope covers monocrystalline silicon slices (HS Code 38180015, diameter >15.24cm, thickness ≤220μm):
- Jan: 511 million wafers, RMB 7.60 bln
- Feb: 564 million wafers, RMB 7.38 bln (volume up, revenue down on price cuts)
- Mar: 1.282 billion wafers, RMB 17.15 bln (H1 shipment peak)
- Apr: 750 million wafers, RMB 9.54 bln
- May: 521 million wafers, RMB 6.34 bln
- Jun: 569 million wafers, RMB 6.71 bln (minor volume bounce, revenue stagnant)
After March’s rush shipments, wafer demand cooled rapidly. Even with slight volume recovery in June, export revenue barely improved, confirming continuous unit price declines. The wafer sector suffers from severe homogeneous capacity expansion and fierce price undercutting; the removal of VAT rebates further compressed already thin gross margins, making wafer manufacturers the most vulnerable segment to policy cost shocks.
3.5 Polysilicon (Upstream Raw Material): Volatile Monthly Shipments, Weak Pricing Fundamentals
Polysilicon export volumes fluctuated wildly month-to-month in H1 2026, with limited pricing support amid global raw material oversupply. Benchmark 2025 monthly average reference: 2.093 million tons volume, RMB 1.33 bln revenue.
- Jan: 1.838 million tons, RMB 2.09 bln
- Feb: 2.215 million tons, RMB 1.98 bln
- Mar: 2.018 million tons, RMB 1.39 bln
- Apr: 1.318 million tons, RMB 0.58 bln (H1 volume & revenue bottom)
- May: 1.899 million tons, RMB 1.90 bln
- Jun: 2.462 million tons, RMB 1.90 bln (H1 shipment volume peak)
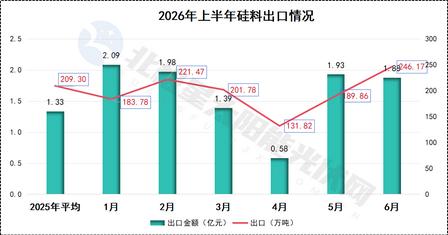
Figure 3: H1 2026 Polysilicon Export Volume & Value
Figure 3 shows polysilicon exports hit rock-bottom in April immediately after rebate cancellation, then recovered gradually through June to reach the half-year maximum shipment volume. However, export revenue in June matched May’s level rather than rising proportionally with volume, indicating polysilicon spot prices remained suppressed. Global polysilicon capacity surplus created a buyer’s market; upstream producers lacked pricing power to transfer the extra VAT cost to overseas silicon wafer factories.
4. Core Drivers Sustaining Export Growth Post Rebate Cancellation
The stronger-than-expected H1 export performance dispels the misconception that China’s PV export competitiveness solely relied on VAT rebate subsidies. Four layered industrial advantages underpinned the counter-cycle growth:
4.1 Unmatched Full-Industrial-Chain Maturity & Cost Synergy
China commands over 95% of global polysilicon capacity, 90% of silicon wafer output, 85% of solar cell production, and 80% of PV module assembly capacity, alongside a complete supporting ecosystem covering glass, silver paste, aluminum frames, junction boxes and manufacturing equipment. Vertical integration enables top manufacturers to offset the 9% rebate cost uplift via internal supply chain cost optimization, scale production efficiency and technological iteration gains—advantages no other country or regional manufacturing cluster can replicate in the short to medium term.
4.2 Accelerated Global Renewable Energy Transition Creates Inelastic Baseline Demand
Nearly all major economies released upgraded carbon neutrality and renewable installation targets during 2025–2026: the EU’s REPowerEU roadmap, emerging markets across Africa, Southeast Asia and Latin America’s universal grid electrification programs, and the Middle East’s large-scale solar utility projects all generated rigid, long-term demand growth. Global PV installation demand growth outpaced temporary cost volatility triggered by China’s rebate policy adjustment, so overseas buyers could not halt procurement for extended periods despite minor price increases.
4.3 Product Structure Upgrade Toward High-Efficiency, High-Margin Goods
Leading manufacturers actively shifted export mix toward N-type TOPCon/HJT solar cells, high-power bifacial PV modules, and hybrid solar-storage inverters with higher technical barriers and profit margins. These premium products carry stronger pricing power, allowing exporters to absorb partial VAT cost increases without massive order losses. Low-margin, homogeneous conventional P-type products gradually lost export share, accelerating industry high-quality transformation as the rebate subsidy buffer vanished.
4.4 Export Market Diversification Reduces Concentration Risk
Prior to 2025, European markets accounted for over 40% of China’s module export volume. In H1 2026, export shares expanded rapidly across Southeast Asia, South Asia, Africa and the Middle East. Emerging markets feature less stringent trade protection measures compared to Western economies, faster distributed solar penetration growth, and less price sensitivity for mid-tier PV products, forming new incremental demand pillars to offset temporary European procurement slowdown post-April.
5. Short-Term Market Challenges Brought by Rebate Elimination
While aggregate exports maintained growth, the policy shift introduced tangible short-term operational pressures for PV exporters:
- Margin Differentiation Widened Sharply Top-tier vertically integrated manufacturers with advanced product lines absorbed cost shocks smoothly, while small-sized single-segment factories focused on low-end wafers/modules faced severe profit erosion, with many small players suspending overseas export businesses temporarily. Industry consolidation accelerated noticeably in Q2 2026.
- Inventory Fluctuation Risks for Global Distributors March’s concentrated panic shipments flooded overseas channel inventories, triggering active destocking cycles in April–May. Many international wholesalers postponed new order placements to deplete existing stock, creating sequential month-on-month shipment declines across midstream wafer/cell/module segments.
- Heightened Trade Competition Risks With fiscal rebate support removed, Chinese manufacturers face intensified competition from third-country assembly bases in Vietnam, Thailand and Malaysia, which still retain local export incentive policies. Western trade blocs’ anti-dumping and anti-circumvention investigations also gained new leverage amid China’s cost adjustment.
- Downward Price Pressure on Standardized Midstream Goods Homogenized silicon wafers and conventional PV modules lack differentiated technical value; fierce oversupply prevented full cost pass-through to buyers, squeezing manufacturing gross margins to multi-year lows for these standardized product categories.
6. Long-Term Structural Transformation Outlook for China’s PV Export Industry
The cancellation of PV export VAT rebates marks a watershed moment shifting China’s solar export industry from volume-driven, subsidy-dependent expansion to technology- and value-led high-quality development. Three irreversible long-term trends will shape the sector’s evolution:
6.1 Accelerated Industry Capacity Consolidation
Weak manufacturers reliant on rebate subsidies to sustain thin positive margins will gradually exit export markets, with market share concentrating among 10–15 leading integrated PV conglomerates that control upstream raw material, advanced cell manufacturing, inverter R&D and overseas localized service networks. The industry will move away from disorderly price wars toward orderly differentiated competition.
6.2 Deepened Localized Overseas Layout
Top PV enterprises will accelerate construction of overseas integrated production bases in Southeast Asia, the Middle East and Latin America, bypassing tariff barriers and reducing reliance on direct exports from mainland China. Localized manufacturing will also shorten delivery cycles for regional clients and mitigate cost volatility risks from domestic fiscal policy adjustments.
6.3 Business Model Upgrade from Component Exports to Full Energy Solution Exports
Instead of only selling standalone wafers, cells and modules, leading suppliers will expand bundled offerings including hybrid inverters, energy storage batteries, PV system design, after-sales operation and maintenance services. Comprehensive solar+storage microgrid and utility-scale power plant EPC solutions deliver significantly higher added value and resilience against raw material and fiscal policy cost shocks.
6.4 R&D Investment Prioritized for Next-Generation PV Technology
With subsidy buffers removed, enterprises must rely on technological breakthroughs to secure profitability. Massive capital will flow into next-generation routes including perovskite-silicon tandem cells, ultra-high efficiency N-type cell manufacturing, low-cost polysilicon production and intelligent inverter control systems, consolidating China’s global technological leadership in renewable energy hardware.
7. Conclusion
The April 1, 2026 cancellation of China’s PV export VAT rebates was initially widely expected to trigger a severe export downturn. However, H1 2026 customs data—USD 17.183 billion core PV product exports, +24.3% YoY—proved China’s PV global competitiveness stems not from fiscal subsidies, but from unrivaled full-chain manufacturing scale, continuous technical iteration, and the secular global energy transition megatrend.
Segmented performance reveals clear divergence across the supply chain: PV modules faced the most drastic post-March shipment correction; solar cells maintained steady intermediate demand support; inverters delivered outstanding sustained growth driven by distributed solar and storage demand; silicon wafers endured persistent pricing pressure; and polysilicon suffered volatile shipment volumes amid raw material oversupply.
In the short run, rebate elimination amplifies margin pressure on low-end standardized product manufacturers and accelerates inventory adjustment cycles for global distributors. From a long-term strategic perspective, the policy adjustment eliminates the industry’s reliance on fiscal subsidies, catalyzes capacity consolidation, pushes manufacturers toward high-value product and solution exports, and steers China’s PV sector onto a sustainable, technology-centric development track.
As global carbon reduction targets continue to escalate, overseas renewable energy demand will retain solid growth momentum. Supported by mature industrial chain advantages and accelerated technological upgrading, China’s PV export business will maintain long-term expansion capacity, evolving from a mere global component supplier to a comprehensive provider of intelligent clean energy solutions worldwide.