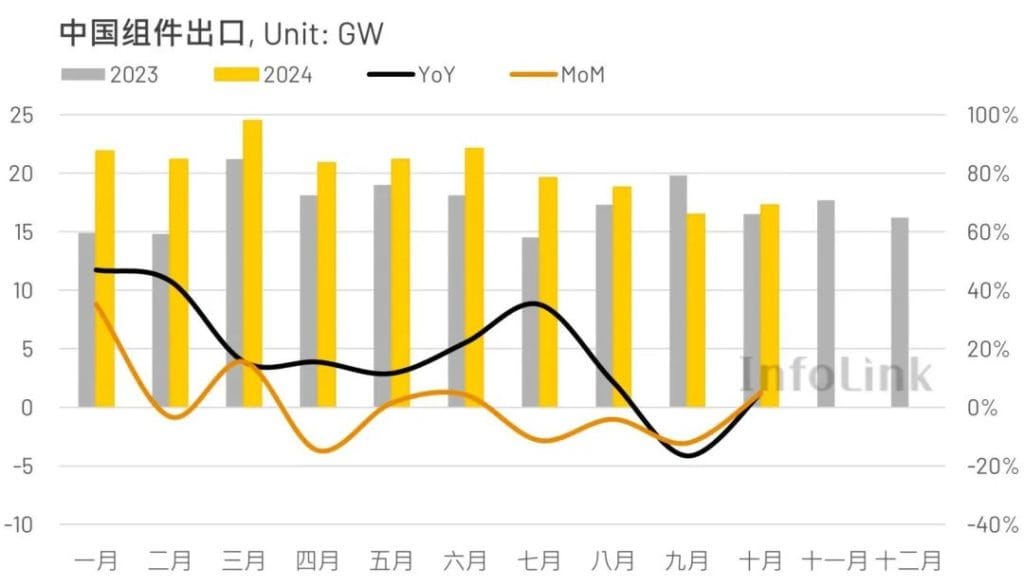
Customs data shows that China exported a total of about 17.34 GW of photovoltaic modules in October 2024, up nearly 5% month-on-month from 16.53 GW in September, and up 5% from 16.45 GW in October last year. From January to October this year, China exported a total of approximately 204.11 GW of photovoltaic modules, an increase of 17% compared to 174.11 GW in the same period last year.
In October this year, the top five single countries in the world importing Chinese photovoltaic modules were the Netherlands, Brazil, Saudi Arabia, Spain and India. The rankings were not much different from September. The top five combined single-month import volume accounted for approximately 42% of the global market. In terms of regional markets, the growth rate in the African market was the most significant; the volume of shipments in the European and Asia-Pacific markets also increased; the American and Middle Eastern markets showed slight declines.

European market
China exported approximately 7 GW of photovoltaic modules to the European market in October 2024, an increase of 3% month-on-month compared with 6.8 GW in September, and an increase of 12% compared with 6.23 GW in October last year. From January to October this year, the cumulative volume of shipments in the European market was approximately 84.67 GW, a decrease of 8% from 91.56 GW in the same period last year.
In terms of individual countries, if we exclude the Netherlands, the largest importer in Europe, and observe the performance of other single countries in October, Spain’s month-on-month increase of 61% is the most significant. Greece, Portugal and Italy also increased their import volume, while Germany and France Countries such as , the United Kingdom and Poland showed varying degrees of decline.
In terms of the overall market, there were no significant changes from September to October this year. The overall environment is still affected by factors such as stagnant economic performance, sluggish power generation revenue, and slowdown in installation speed. Although the import volume in October increased slightly by 3% month-on-month, it was generally It still maintains the level of shipments in September, which is lower than the average pull volume of 8.4 GW from July to August. In addition, the European market will enter the Christmas holiday off-season in December, and the intensity of shipments will continue to increase before the end of the year. Slow down, manufacturers have begun to gradually increase their efforts to sell goods in early November. If we refer to the 101.48 GW exported to Europe in 2023, there is a high probability that the amount exported to the European market will experience negative growth this year.
Asia-Pacific market
In October 2024, China exported about 4.34 GW of photovoltaic modules to the Asia-Pacific market, up 13% from 3.86 GW in September and down 26% from 5.88 GW in October last year. From January to October this year, the cumulative cargo volume of the Asia-Pacific market was about 58.47 GW, up 49% from 39.28 GW in the same period last year.
The countries with increased import volume in Asia in October were mainly Japan, Australia, Uzbekistan, Thailand and the Philippines. India and Pakistan, which were previously ranked at the top of the Asia-Pacific market, both fell. First of all, India imported about 0.84 GW of Chinese photovoltaic modules in October this year, down 23% from 1.1 GW in September. From January to October this year, it imported about 15 GW of Chinese photovoltaic modules. Previously, Chinese component manufacturers speculated that India’s ALMM list exemption would have the opportunity to include Chinese components, but according to the list updated on August 28 this year, most of them are Indian manufacturers. The only foreign company is the Indian subsidiary of an American manufacturer, and most of the registered products are made in India. As India’s local production capacity increases, the possibility of Chinese components being included in the ALMM list exemption will gradually decrease in the future, and India will gradually reduce its demand for foreign components.
In Pakistan, about 258 MW of Chinese photovoltaic components were imported in October this year, a 10% decrease from 287 MW in September. From January to October this year, a total of about 14.85 GW of Chinese photovoltaic components were imported. Pakistan has recently increased its dealer inventory level due to a large amount of goods in the first half of this year, and the import volume has dropped significantly since September. However, observing the data at the end of 2023, it is not ruled out that Pakistan will increase its monthly goods in November and December this year to fill the volume gap from September to October, and considering that China’s export tax rebate is determined to be adjusted from December, it will increase the incentive for buyers to pull goods. However, adjustments to the net metering price of photovoltaic grid-connected electricity are likely to change, which may lead to a downward adjustment in the forecast demand for 2025.
Americas Market
In October 2024, China exported about 2.61 GW of photovoltaic modules to the Americas market, a 2% decrease from 2.66 GW in September and a 3% decrease from 2.74 GW in October last year. From January to October this year, the cumulative cargo volume in the Americas market was about 26.92 GW, a 10% increase from 24.44 GW in the same period last year.
In October this year, Brazil was the largest country in terms of the proportion of China’s exports of photovoltaic modules to the Americas market, with a total import of about 1.7 GW of Chinese photovoltaic modules in October, a 2% increase from 1.66 GW in September, accounting for 65% of the total import volume in the Americas market. From January to October this year, Brazil imported a total of about 18.42 GW of Chinese photovoltaic modules.
Since the Brazilian government implemented the second phase of duty-free import quotas (early July 2024 to the end of June 2025) in July this year, the volume of recent imports has been maintained at around 1.5-1.7 GW. The total amount of component imports from July to October was approximately US$722 million, accounting for 71% of the duty-free quota of US$1.01 billion. If the imports from November to December remain at 1.5-1.7 GW, the duty-free import quota is expected to be used up by the end of this year. On November 11 this year, the Ministry of Development, Industry, Trade and Services (MDIC) of Brazil announced that the 9.6% tariff imposed on imports exceeding the duty-free import quota would be increased to 25%, which will have a negative impact on the demand for Brazilian components next year.
Middle East and Africa
In October 2024, China exported about 2.23 GW of photovoltaic modules to the Middle East market, down 8% from 2.43 GW in September and up 50% from 1.49 GW in October last year. From January to October this year, the total volume of cargo shipped to the Middle East market was about 25.12 GW, up 113% from 11.81 GW in the same period last year.
In October this year, Saudi Arabia was the largest country in terms of the proportion of China’s exports of photovoltaic modules to the Middle East market. In October, a total of about 1.5 GW of Chinese photovoltaic modules were imported, up 3% from 1.45 GW in September, accounting for 67% of the total import volume of the Middle East market. From January to October this year, Saudi Arabia imported a total of about 14.4 GW of Chinese photovoltaic modules. Saudi Arabia’s demand for modules mainly depends on the tenders released by the local government. Starting this year, it is expected to bid at least 20 GW of renewable energy projects each year, and photovoltaics are its main development force, and long-term demand is expected to continue to grow.
In October 2024, China exported about 1.19 GW of photovoltaic modules to the African market, up 51% from 0.79 GW in September and up 165% from 0.45 GW in September last year. From January to October this year, the cumulative cargo volume in the African market was about 8.93 GW, up 27% from 7.02 GW in the same period last year.
In October this year, South Africa was the largest country in terms of the proportion of photovoltaic modules exported by China to the African market, with a total import of about 568 MW of Chinese photovoltaic modules in October, up 148% from 229 MW in September, accounting for 48% of the total import volume in the African market. From January to October this year, South Africa imported a total of about 3.26 GW of Chinese photovoltaic modules. Even though South Africa imposed a 10% tariff on imported photovoltaic modules at the end of June this year, it still relies heavily on imported modules when local production capacity has not started. In recent months, cargo has been driven by the recent demand for local ground projects.
Overall, there was no significant change in the import performance of global regional markets in October this year. Generally speaking, there were slight increases and decreases to varying degrees based on the level of shipments in September. However, as the European market entered the holiday off-season in the fourth quarter; India is gradually reducing its demand for foreign components; local distributors in Pakistan currently have high inventory levels; and Brazil’s duty-free import quota may be exhausted by the end of this year. Various factors will lead to a decline in the volume of China’s component exports overseas in the fourth quarter of this year, and it is difficult to achieve a full-year decline. substantial growth.


